砖形 - VSRD (Renko - VSRD) | 外汇指标下载 - MT4/MT5资源

VSRD - Volume /Support/ Resistance /Divergence
Hello! I just want to share a renko Trading System with Volume /Support/ Resistance /Divergence.
Its simple. We will use the Dr. Alexander Elder definition for divergence, plus some S/R indicators.
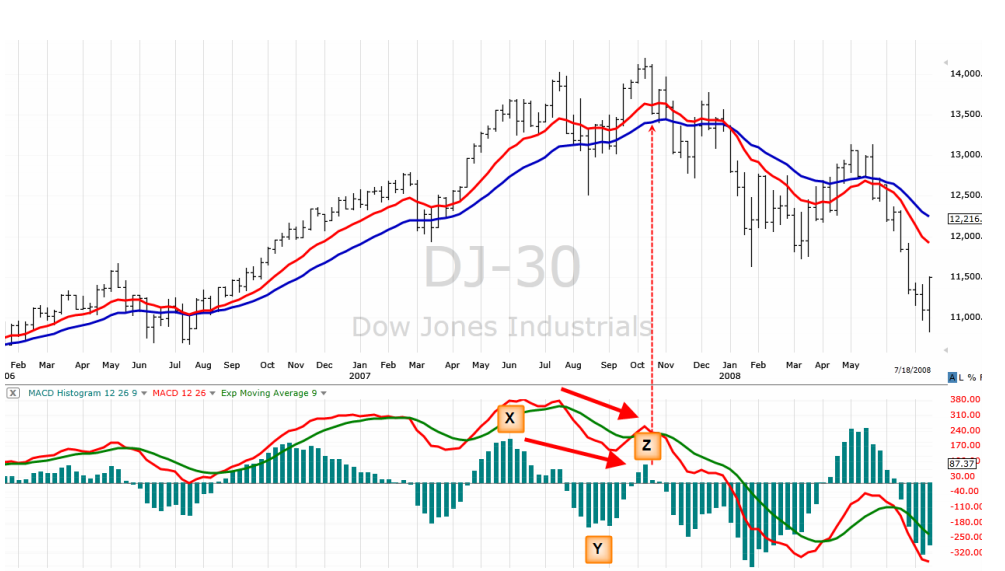
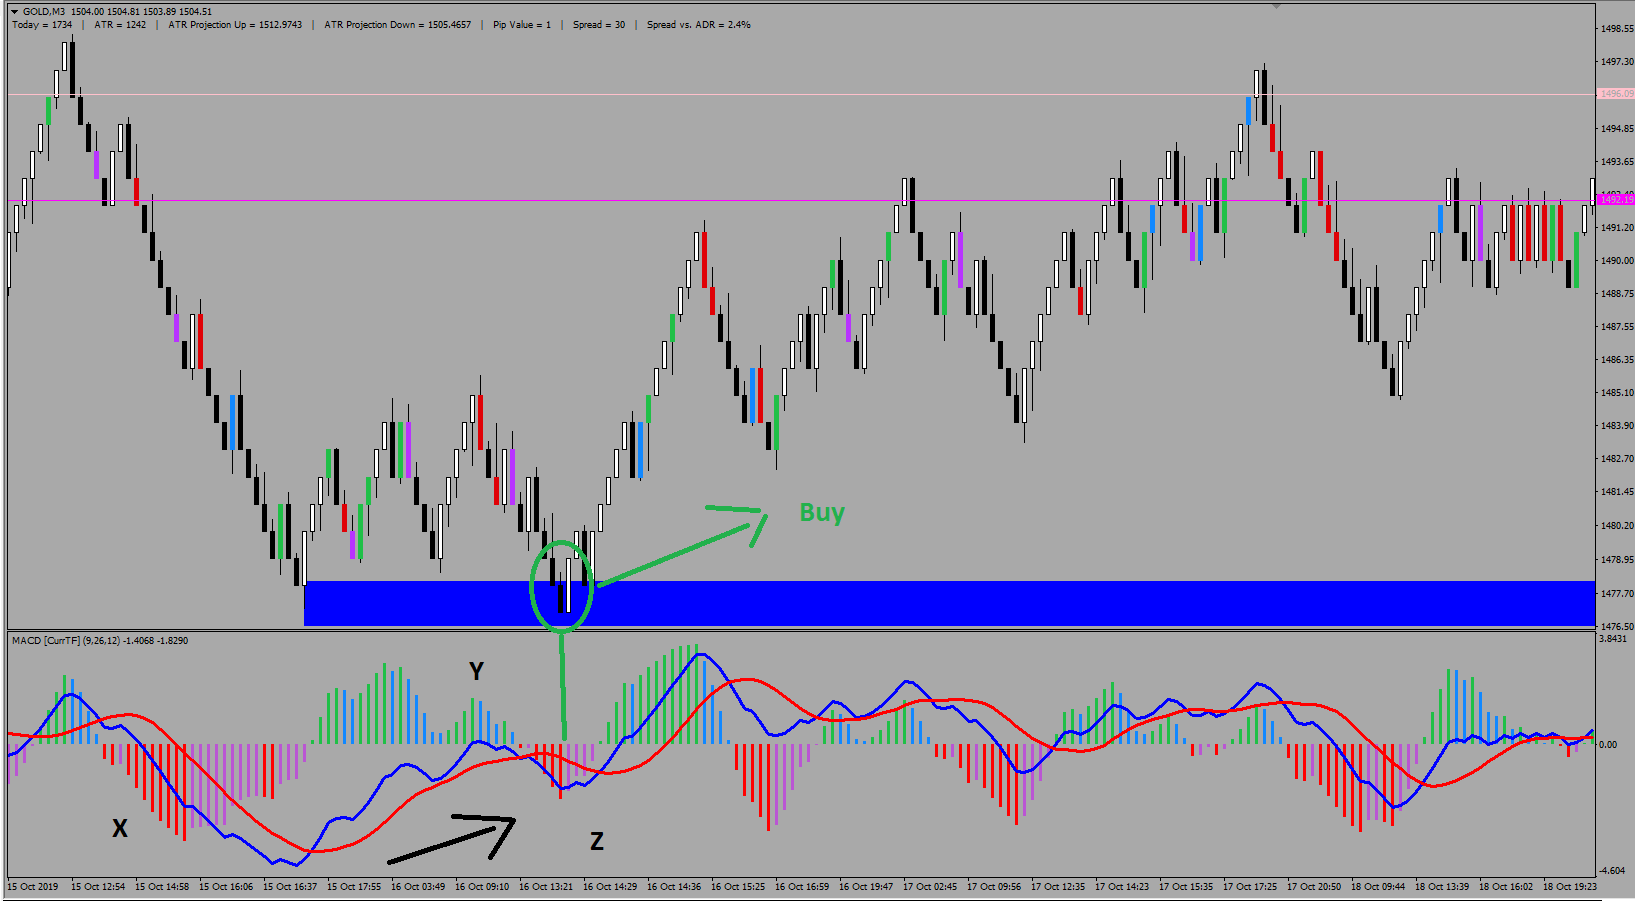
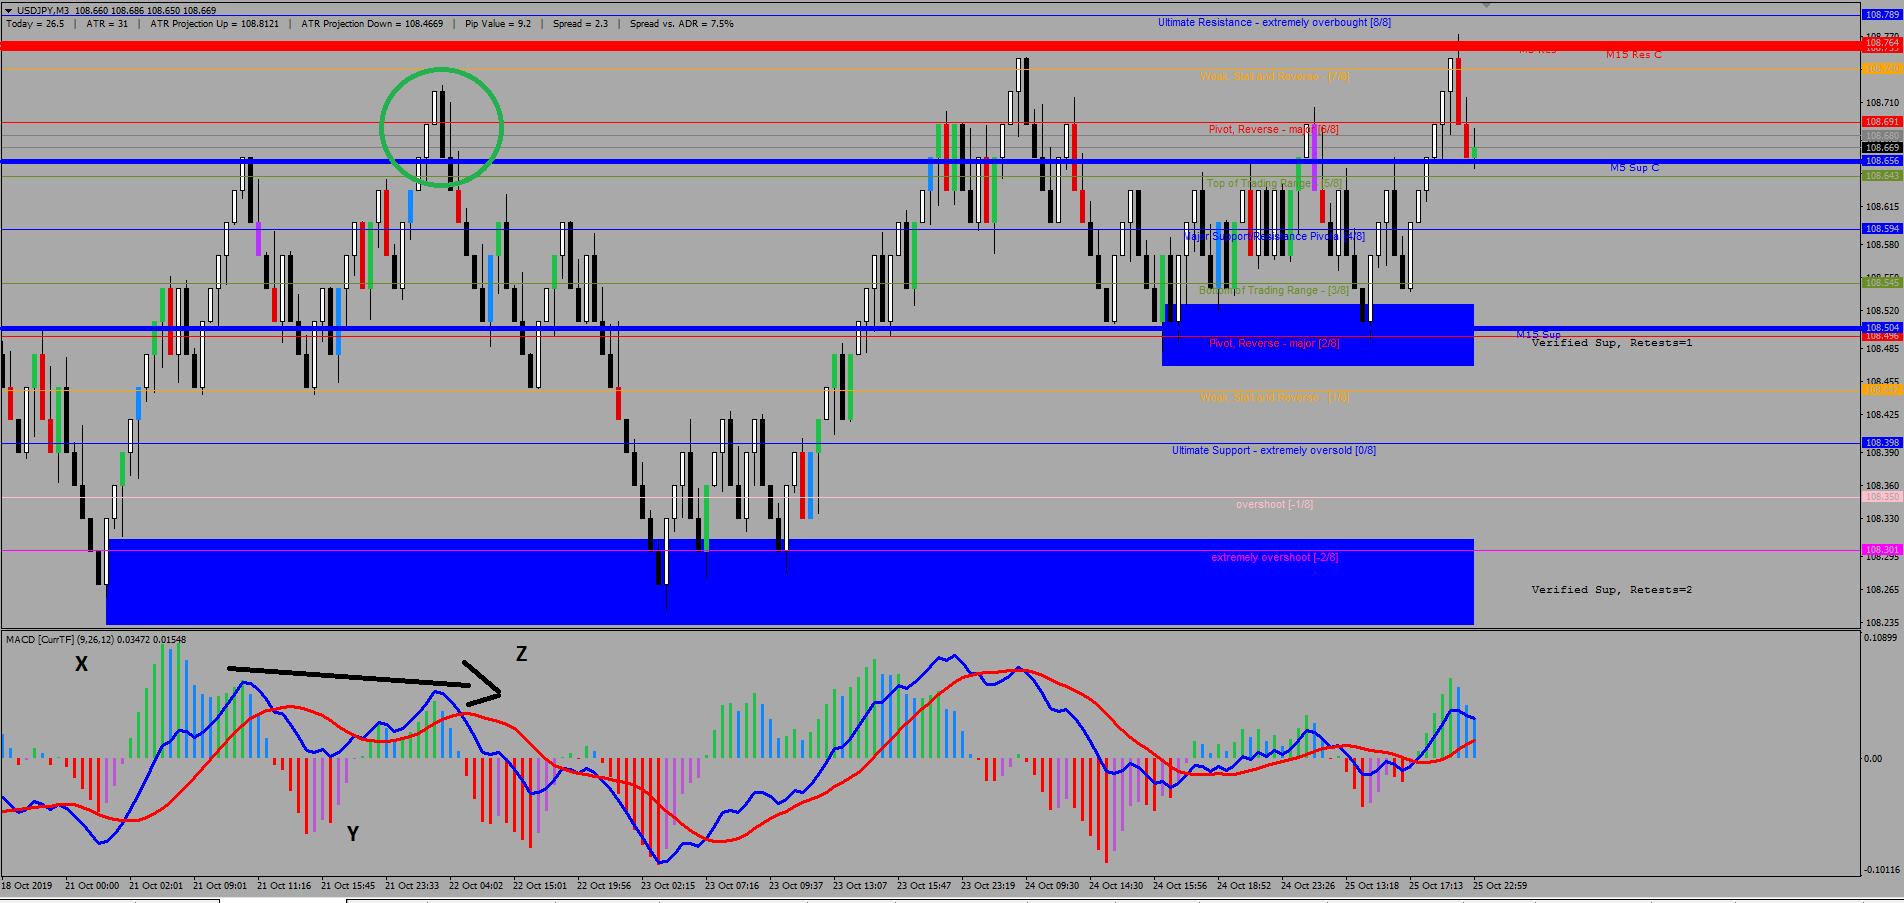
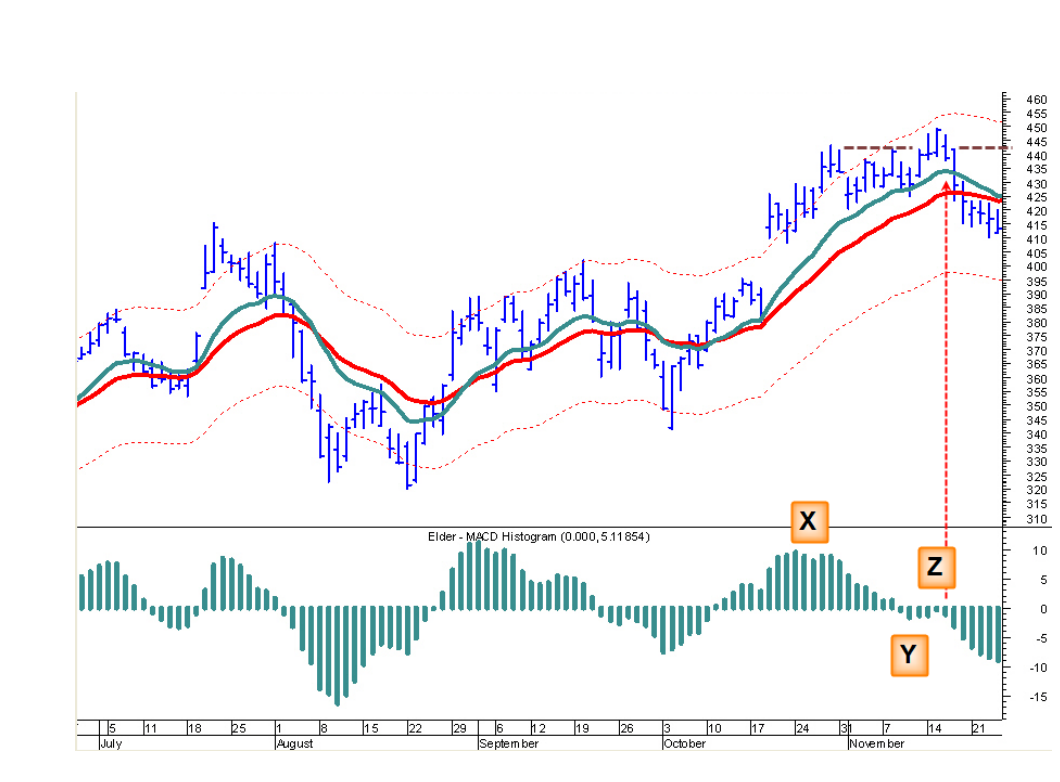
"Remember that when tracing a divergence, we first look at the pattern of MACD, followed by the pattern of prices. Keep in mind as well that the indicator has to cross and re-cross its centerline in order to mark a valid divergence. In area X the Dow rallied to a new bull market high and MACD-Histogram rallied with it, rising above its previous peak and showing that bulls were extremely strong. This indicated that the price peak X was likely to be retested or exceeded. In area Y, MACD-H fell below its centerline, ‘breaking the back of the bull.’ Notice that prices punched below their value zone between the two moving averages. This is a fairly common target for bull market breaks. In area Z, the Dow rallied to a new bull market high, but the rally of MACD-H was feeble, reflecting the bulls’ weakness. Its downtick from peak Z completed a bearish divergence, giving a strong sell signal, auguring in one of the nastiest bear market in decades. Notice that breaking of the centerline between two indicator tops is an absolute must for a true divergence. MACD-Histogram has to drop below its zero line before rising to the second top. If there is no crossover, then there is no divergence. Another key point: MACD-H gives a sell signal when it ticks down from the second top. We do not need to wait for it to cross below the centerline again. The sell signal occurs when MACD-H, still above zero, simply stops rising and traces out a bar that is shorter than the preceding bar. The message of this bearish divergence was reinforced by MACD Lines tracing a bearish pattern between the tops A and C. The second top of MACD Lines was more shallow than the first, confirming the bearish divergence of MACD-H. Such patterns of MACD Lines tell us that the coming downtrend is likely to be especially strong. " - Dr. Alexander Elder
1- Use Load ALL History Script to load m1 to renko chart
2- use EA Renko chat creator
3. Load Template.
Hello! I just want to share a renko Trading System with Volume /Support/ Resistance /Divergence.
Its simple. We will use the Dr. Alexander Elder definition for divergence, plus some S/R indicators.
"Remember that when tracing a divergence, we first look at the pattern of MACD, followed by the pattern of prices. Keep in mind as well that the indicator has to cross and re-cross its centerline in order to mark a valid divergence. In area X the Dow rallied to a new bull market high and MACD-Histogram rallied with it, rising above its previous peak and showing that bulls were extremely strong. This indicated that the price peak X was likely to be retested or exceeded. In area Y, MACD-H fell below its centerline, ‘breaking the back of the bull.’ Notice that prices punched below their value zone between the two moving averages. This is a fairly common target for bull market breaks. In area Z, the Dow rallied to a new bull market high, but the rally of MACD-H was feeble, reflecting the bulls’ weakness. Its downtick from peak Z completed a bearish divergence, giving a strong sell signal, auguring in one of the nastiest bear market in decades. Notice that breaking of the centerline between two indicator tops is an absolute must for a true divergence. MACD-Histogram has to drop below its zero line before rising to the second top. If there is no crossover, then there is no divergence. Another key point: MACD-H gives a sell signal when it ticks down from the second top. We do not need to wait for it to cross below the centerline again. The sell signal occurs when MACD-H, still above zero, simply stops rising and traces out a bar that is shorter than the preceding bar. The message of this bearish divergence was reinforced by MACD Lines tracing a bearish pattern between the tops A and C. The second top of MACD Lines was more shallow than the first, confirming the bearish divergence of MACD-H. Such patterns of MACD Lines tell us that the coming downtrend is likely to be especially strong. " - Dr. Alexander Elder
1- Use Load ALL History Script to load m1 to renko chart
2- use EA Renko chat creator
3. Load Template.
原帖附件 (1)
💡 精彩内容推荐
✍️ 楼主最新发布
- •
- •
- •
- •
- •
- •
📌 热门专题入口
- •
- •
- •
- •
- •
- •
- •
- •
🔗 您可能感兴趣
- •
- •
- •
- •
- •
- •
🔐
请登录后参与评论
注册满12小时后评论,即可解锁附件下载
立即登录


